How to set & measure KPIs (to increase your odds of hitting goals)
There are so many goal-setting terms — OKRs, KPIs, MBOs, V2MOM, SMART goals — at a certain point they all start to blend together. Let's ignore the jargon and talk about how to we can use things like KPIs to increase your odds of hitting your goals.
 Brennan
Warning: Undefined array key "category" in /www/hypercontext_216/public/wp-content/themes/Soapbox/hype-files/sections/article/content.php on line 10
Goal-setting terms are overwhelming and jam packed with acronyms. Depending on where you work or who you ask, they start talking non-stop about random letters, sounds or objects: MBOs, OKRs, KPIs, V2MOM, S.M.A.R.T., or even Rocks 🗿
At a certain point, it all blends together. And by the end of the conversation we’re still sitting there wondering, “How do I set KPIs? How do I measure KPIs? How do I make it useful for my team?”
In this post, I’ll cover the importance of KPIs and how they differ and how their lessons can be incorporated into any goal-setting frameworks.
- What a KPI is
- What makes a good KPI
- Some examples of strong KPIs
- How to measure KPIs
- How to reflect and notice patterns in your KPIs
- Try our template
What is a KPI?
Let’s start at the start: At its core, a Key Performance Indicator (KPI) is a metric that should lead you toward an end goal. KPIs indicate future success and are often set for individuals or groups to help create a focus.
If we look at this through the lens of trying to achieve a particular revenue milestone, your KPIs may be things like:
- Deals influenced in pipeline
- Website visitors
- Leads generated from organic content
- etc
These metrics will help companies predict if they can achieve their top line goals.
What makes a good KPI?
Now that we know what a KPI is, let’s dive into what makes a good KPI. First things first, setting KPIs shouldn’t be a solo exercise. This needs to be done collaboratively with various stakeholders involved.
Here are three critical factors to take into account when setting KPIs.
1. Weekly not monthly
Looking at KPIs monthly is too long of a period for maximum effectiveness. With KPIs, you want as many chances as possible to review and check in on them. Having 52 opportunities to make adjustments to achieve your goals, as opposed to 12, will put people in a much better position to hit their KPIs and achieve their goals consistently.
2. Leading not lagging
KPIs need to be leading indicators, not lagging indicators.
What’s the difference?
Lagging indicators measure current production and performance. Examples are revenue or the percentage of customer conversations that have been closed –– once you’re measuring these things, it’s already too late to affect them.
Leading indicators will inform you on how to produce and achieve your desired result. So, if you have a goal to hit a certain revenue number, leading indicators that you may want to measure and monitor are the various steps that a dollar has to take on its path to becoming revenue –– these can include things like:
- Trial starts
- Movements through a pipeline
- Dollars in a particular stage of the pipeline
These are work-in-progress steps to achieve the larger revenue goal. Measuring these will be a good indicator of whether or not you are on your way to achieving your goal or, alternatively, help to provide insights into adjustments and improvements required to get there.
3. Up and to the right (for simplicity)
It’s important to ensure that all KPIs can go up and to the right, meaning as time goes on, they should be able to improve.
Think of a graph where the x-axis represents time, and the y-axis represents the performance of your KPI. Things are getting better if the chart is going up and trending toward that top right corner.
A general rule of thumb: KPIs should pass the “skim test” ––if you’re busy and just skimming through a dashboard, you should immediately be able to identify if something is good or bad.
That said, not all metrics should technically go up and to the right. Churn rate is an excellent example of this. Higher churn is terrible for a business, so, in this case, up and to the right would be negative. To keep consistency with the rest of your KPIs, ensuring that they all continue to pass the “skim test,” you instead may want to measure retention rates.
KPI examples
No two businesses are exactly alike, which means each one will have its own unique mix of KPIs to measure and monitor if they are on the right track toward achieving their objectives. Although, there are a few KPIs that are specific to SaaS companies. Let’s take a look at these examples:
- Sign-ups: Whether it be for a free trial, webinar, or guide to download, signups can indicate interest in your brand or product offering.
- Conversion rates: Conversion rates can help you identify what’s normal and if something has gone wrong. Conversion from one stage of pipeline to the next, or conversion from key landing pages to CTA clicks are great indicators of heathy process.
- Expansion revenue: After a company acquires a customer, there are often add-ons, tiers and/or more significant deals they can explore to further expand the revenue of a specific account.
- Retention: Once a customer is acquired, businesses must retain that account to keep their revenue moving up and to the right.
- Active Customers: This KPI measures how many customers are actively using the product. Low active customers can indicate the potential for high churn.
- NPS: Net Performance Score (NPS) essentially measures how likely a customer is to refer you. This score can help companies identify if the customer is happy and will continue subscribing/using the product for a long time or if they’re at risk of churning.
Three steps to measure KPIs
As an organization, once you’ve established what your KPIs are, it’s essential that you then set up a system that will help you to stay on top of them. In this section, we’ll walk through the three steps we use at Hypercontext to track and measure our own KPIs.
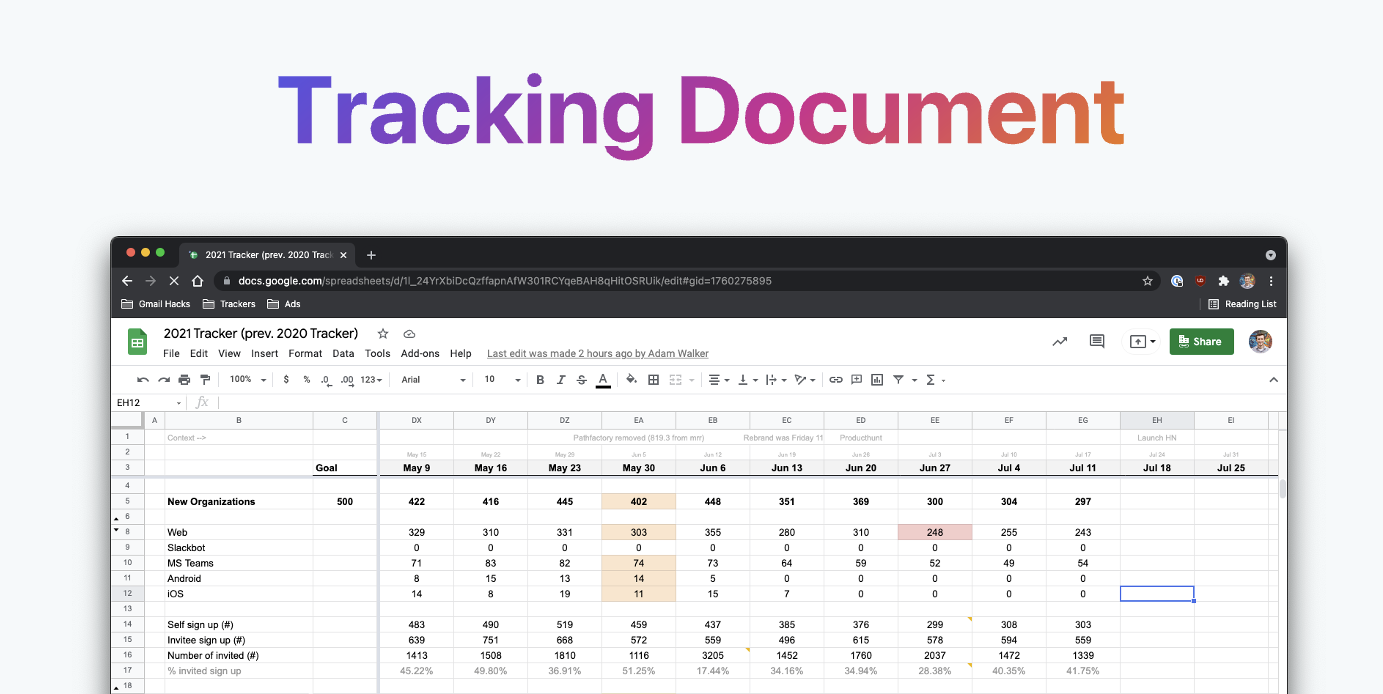
- Create a tracking document
First, let’s start with the layout for the tracking document. The columns are the weekly dates, and the rows are all of our important KPIs/conversion rates.
This should be a living document––don’t worry about making it perfect. The tracking document shouldn’t be set in stone, as you need to be able to hide rows that become irrelevant and add rows whenever another metric is required to improve your tracking.
At Hypercontext, we track 47 metrics/rates at the company level on this master document and share it across the organization. Whoever owns a given metric will manually add/update their numbers every week on this shared sheet.
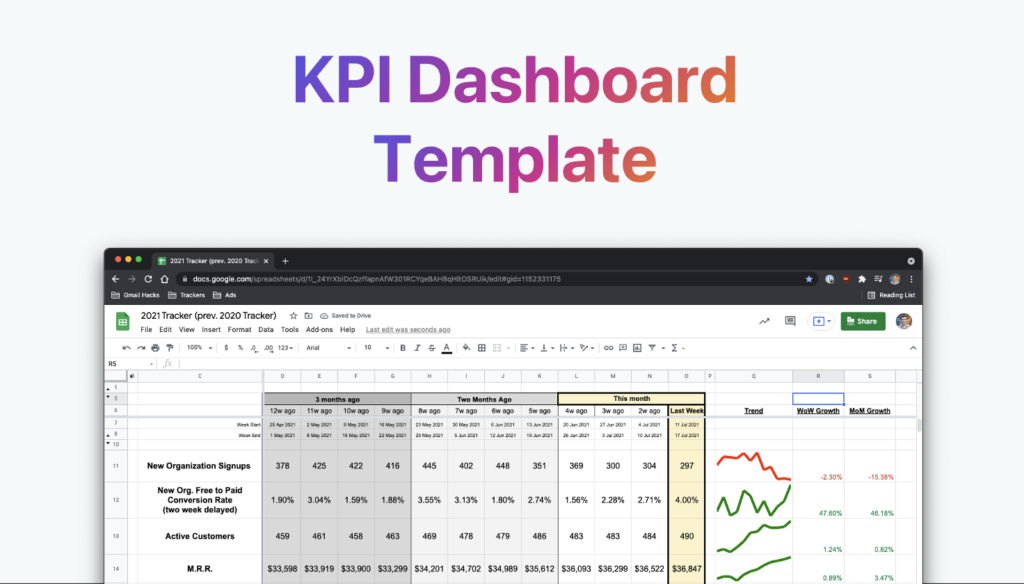
- Narrow down your tracker into a dashboard
The next step is creating a KPI dashboard. The dashboard pulls the data from our tracking document mentioned above, only showing the last 90 days of info at any given time. It contains all the information from the tracking document and highlights key performance information.
We also format the dashboard to show our best and worst weeks, allowing us to identify trends and patterns more easily.
- Share the information
Lastly, here’s how the KPI information gets shared throughout Hypercontext:
- First, a co-founders meeting takes place every Monday at 10 am to review the performance of our KPIs. Here the first order of business is to discuss the dashboard, formulate our thoughts on the data, and determine if any new actions need to occur.
- Second, we have a 1 pm town hall meeting that same day where key results and the 90-day trendline gets shared with the wider team. At this meeting, Graham and I also take the opportunity to share: news, our thoughts on the new KPI data, and what we’re planning to ship to customers.
- The final step is the investor email. This includes a PDF file of the complete dashboard sheet and KPI screenshots from the dashboard with notes adding context.
Reflect and notice patterns in your KPIs
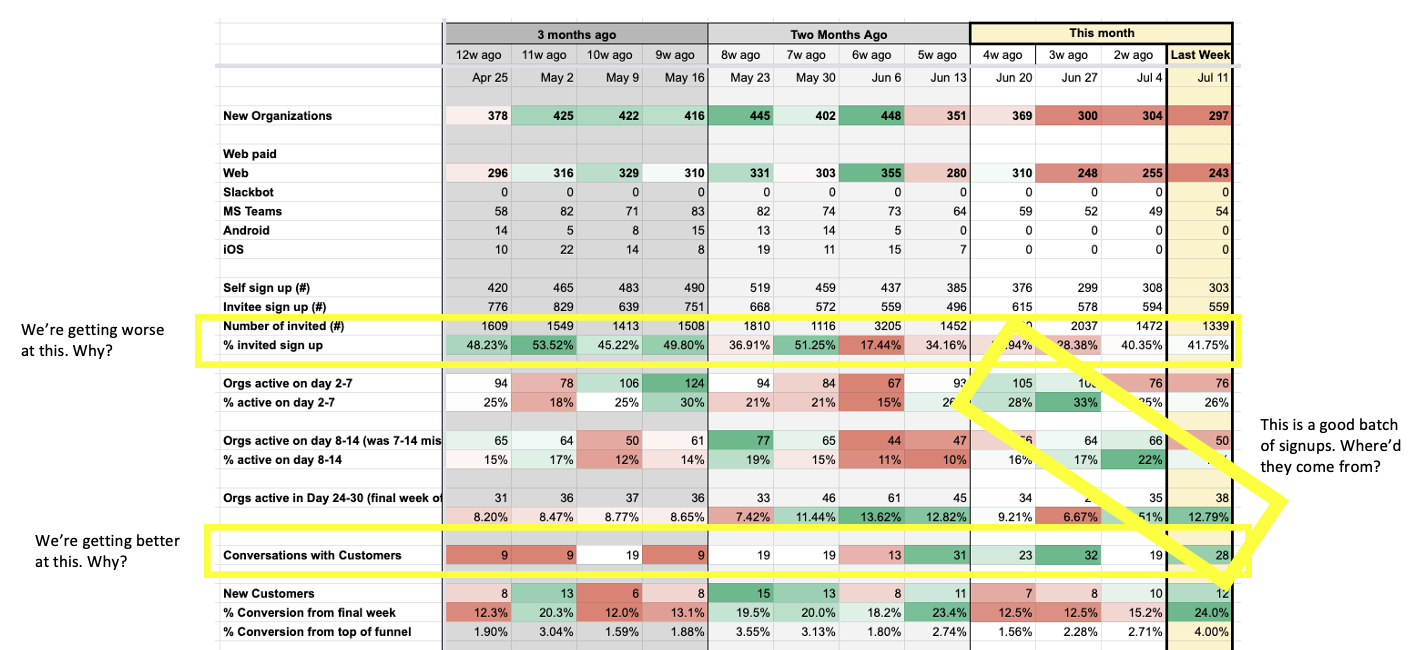
Once you’ve set your KPI tracker up, add conditional formatting on the cells. By default that will mean the KPIs will go to go RED when it going down and GREEN when it’s going up — but you can change this if you want GREEN to be above a certain number, or RED below a certain number. Set it up the way tat makes the most sense.
Once done this will will allow you to quickly and visually notice patterns. Seeing those patterns will tell you nothing, but they will allow you to ask questions to discover new insights about your business, market, customers, team, etc. It’s best to bring things insights to your team to see if they notice other patterns or discover other insights.
Give our free template a try!
When it comes to your team achieving its goals, KPIs are an important piece of the puzzle.
If you’re interested in a centralized document that your team can use to enter, track, and measure its KPIs, then give Hypercontext’s KPI tracker template a try!
What you should do next
Next, here are some things you can do now that you've read this article:
- Check out the largest library of Goal & OKR examples on the internet (free).
- You should try Spinach to see how it can help you run a high performing org.
- If you found this article helpful, please share it with others on Linkedin or X (Twitter)
